Key metrics
- 2,964 West African cities - small, intermediate and large urban agglomerations projected under a very-high-emissions scenario to experience more than 180 days above 35°C around 2050. [1]
- Nearly twice as frequent - the indexed frequency of hot days across the 28 African countries assessed in 2024 compared with the 1990 baseline. [1]
- US$14.8 billion - tracked adaptation finance to Africa in 2023, against assessed annual need of at least US$70 billion. [5]
- Seven countries - current African coverage of the World Bank Adaptation and Resilience Readiness Assessment discussed in the 2026 joint report. [1]
EXECUTIVE THESIS
A hazard becomes investable only when somebody can act on it
Climate risk often arrives in government as a map and leaves as a paragraph. Between those two points, its resolution is lost.
A national plan may recognise extreme heat. A city map may locate the hottest districts. A budget circular may ask ministries to tag climate spending. A development bank may require climate screening. Yet the market roof remains unshaded, the school timetable unchanged, the substation ventilation unprotected and the road specification based on an older climate. Each institution can truthfully say it has considered the risk while the service exposed to it remains the same.
New evidence makes this implementation gap harder to ignore. In September 2026, the OECD, Global Green Growth Institute and World Bank published a joint assessment using climate-hazard, urban and policy datasets for 28 African countries, which together account for about 73 per cent of the continent's greenhouse-gas emissions. It finds that the frequency of hot days across the countries assessed has nearly doubled since the 1990s, while extreme precipitation has risen by more than 150 per cent. [1]
The urban implications are especially sharp. Under a very-high-emissions scenario, the report projects that by mid-century 2,712 small, 229 intermediate and 23 large West African cities could experience more than 180 days a year above 35°C: 2,964 urban settlements exposed to such heat for over half the year. [1] This is a scenario, not a forecast. It is also a decision signal. Roads, power equipment, clinics, schools, homes, warehouses and outdoor workspaces being designed now may still be operating then.
The same report exposes an asymmetry. Hazard monitoring has advanced, but comparable tracking of adaptation policy and interventions has not. Its Adaptation and Resilience Readiness Assessment covers seven African countries and cannot yet support continent-wide benchmarking. Climate budget tagging, contingent-liability planning and systems for tracking outcomes remain underdeveloped in much of the region. [1]
That asymmetry matters because finance is already scarce. A 2025 assessment by the Global Center on Adaptation and Climate Policy Initiative estimated that Africa needs at least US$70 billion a year for adaptation, while tracked flows reached US$14.8 billion in 2023. [5] Scarcity makes prioritisation more important, not less. It raises the standard of proof required to decide where limited public, concessional and private capital should go.
The central proposition of this paper is simple: climate data should be treated as decision infrastructure. Its value is not the number of maps produced or dashboards launched. Its value is whether it changes land use, asset design, operating practice, public protection and capital allocation in the places where risk and vulnerability meet.
STONECOMMS ORIGINAL SYNTHESIS
A climate dataset becomes decision infrastructure only when it can travel through seven linked fields: place, threshold, people and service, decision, owner, finance, and result. StoneComms calls this the Decision-Ready Climate Record. It is not a new hazard model. It is a translation layer that ties existing evidence to the public or commercial action it is meant to change.
The framework is derived from current African climate-risk, public-finance and adaptation-finance evidence. [1][3][4][5][6][7][8] It is an analytical proposal for testing, not a planning standard, engineering specification or claim that data alone can overcome political economy. The harder questions - who is protected, who pays, whose loss counts and which neighbourhood waits - remain choices. The purpose of the record is to make those choices visible.
KEY FINDINGS
01 | Better hazard data has not yet produced an equivalent record of adaptation
The new joint report can compare climate hazards and mitigation policy across countries, but it cannot provide the same continent-wide account of which adaptation interventions exist or whether they work. That gap limits learning, accountability and finance allocation. [1]
02 | National averages are too blunt for many investment decisions
Heat, flood and drought exposure vary sharply within countries. A national score can guide strategy; it cannot decide which market needs shade, which feeder needs reinforcement or which road segment needs a different drainage standard. The decision unit is often subnational and asset-specific. [1]
03 | The financing gap is also a preparation gap
Africa's tracked adaptation finance more than doubled between 2017 and 2023, yet remained far below assessed need. Finance is particularly limited for climate-resilient transport, energy, industry and buildings. Stronger mandates, priority programmes, costed interventions and project preparation determine whether need becomes an investable pipeline. [5]
04 | Heat shows why risk must be treated as a service problem
Extreme heat affects health, labour productivity, electricity demand, water systems and the reliability of equipment. These effects belong to different institutions. A heat map becomes useful when it changes a service decision: working hours, school design, market shade, emergency protocols, cool roofs, tree cover, substation cooling or social protection.
05 | A dashboard without an owner can create the appearance of readiness
Publishing climate information is not the same as assigning responsibility. If no agency has the authority, budget and operating capacity to act when a threshold is crossed, the dashboard records exposure rather than reducing it.
06 | Evidence must follow the intervention after money is spent
Adaptation is difficult to compare because its outcomes are local, multi-causal and often measured as avoided loss. That is not a reason to stop measuring. It is a reason to preserve baselines, assumptions, implementation records and distributional results so that future decisions improve.
1 | WHY THIS MATTERS NOW
Africa is building into the risk
Africa's climate exposure is rising at the same time as its urban form, energy systems and infrastructure networks are expanding. An estimated 61 per cent of the continent's total urban area in 2050 has not yet been built, according to the 2026 joint report. [1] That creates a rare opportunity: future exposure can be influenced before streets, plots, materials, drainage, rights of way and service networks become expensive to change.
It also creates a danger. Climate resilience is often discussed as a retrofit to an already designed development pathway. In fast-growing cities, the more consequential choice is upstream: where development occurs, how streets are oriented, which surfaces absorb heat, whether public space is shaded, how stormwater moves, what temperature equipment is rated for and who can reach a cooling or health service when conditions become dangerous.
The World Meteorological Organization reported in June 2026 that Africa is warming faster than the global average and that the rate since 1991 is substantially higher than in the previous three decades. Its review of 2025 found floods remained the most frequently reported hazard, drought affected more than 8.5 million people in East Africa and early-warning gaps persisted despite progress. [2] These hazards do not respect departmental boundaries. A flood is simultaneously a drainage, transport, health, education, trade and fiscal event. Heat is an occupational, energy, housing, health and productivity event.
The financial context is equally unforgiving. The 2026 joint report concludes that current climate-finance flows meet only about a quarter of Africa's estimated annual climate needs, including around 20 per cent of adaptation needs. It also reports that the ten most climate-vulnerable African countries receive significantly less adaptation finance than other low-income countries. [1] UNEP's 2025 global assessment placed developing-country adaptation needs at US$310-365 billion a year by 2035, compared with US$26 billion in international public adaptation finance in 2023. [6] The scopes differ, but both point to the same discipline: each funded intervention has to do more than acknowledge climate risk.
Data can help direct scarce capital, but only if it is connected to authority. A beautifully resolved heat surface does not know which ministry owns a school. A flood model cannot amend a building code. A vulnerability index cannot procure shade. Those are institutional acts.
2 | THE MAP IS NOT THE DECISION
Hazard, exposure and vulnerability answer different questions
A hazard map describes a physical condition: temperature, rainfall, drought, wind, river flow, coastal flooding or fire weather. An exposure map identifies people, assets, land or economic activity located within that condition. A vulnerability assessment asks why the same hazard causes different harm: building material, health, age, income, tenure, occupation, access to services, system redundancy or political neglect.
These layers are related but not interchangeable. A district with the highest daytime land-surface temperature may not be the place with the greatest risk of mortality. A lower-temperature district may contain a hospital with failing backup power, a dense settlement with metal roofs or a concentration of outdoor workers without shade. An expensive asset may dominate an avoided-loss model while a poorer neighbourhood bears greater human harm.
The new 2026 datasets are valuable precisely because they reveal spatial differences that national averages conceal. In Niger, the report projects that under a very-high-emissions scenario nearly 60 per cent of land area could experience more than 270 days above 35°C by the end of the century. [1] Yet the policy value lies less in the national percentage than in the local differences beneath it: which settlements, farms, roads and services face prolonged exposure, and what can be changed before that exposure becomes locked in.
This distinction changes the data request. A finance ministry does not need a hotter colour on a map. It needs a defensible link between a location, a service at risk, a proposed response, a cost, a delivery institution and an expected result. A city engineer needs thresholds relevant to materials and operations. A health department needs vulnerable populations, clinical protocols and lead times. A market authority needs shade, water, ventilation, hours and maintenance. The same climate layer must support different decisions without pretending they are one decision.
3 | HEAT IS A TEST OF GOVERNMENT COORDINATION
The thermometer crosses more budgets than the budget system recognises
Extreme heat is a useful test because it is both pervasive and institutionally homeless. It rarely destroys a single visible asset in the manner of a collapsed bridge. Instead it reduces work capacity, worsens illness, raises cooling demand, accelerates material degradation and pushes equipment closer to failure. Losses accumulate across households, firms and public services.
The World Bank's 2025 urban-heat handbook warns that the number of urban poor exposed to dangerous heat could rise by 700 per cent by 2050, with the greatest impacts expected in Africa and Asia. It notes that urban heat islands can make cities up to 10°C hotter and that informal settlements can experience higher temperatures because of limited greenery, heat-trapping materials and weak service provision. [3] These are global-south findings, not uniform African city estimates. They establish the scale of the planning problem, not a single local temperature premium.
The investment menu is broad. A 2026 World Bank technical note groups action across protection of people during extreme heat, reduction of exposure in the built environment, resilience of infrastructure and enabling policy and institutions. It points to cooling and ventilation upgrades for substations, pumping stations, control rooms and depots; redundancy and backup power for critical services; heat alerts; shade; building retrofits; and public-space interventions. [4]
That range explains why heat plans can stall. The meteorological service may issue the warning. The health ministry may own public advice. Labour authorities set occupational rules. Municipalities control markets and streets. Utilities operate substations and pumps. Education ministries control schools. Housing may be split between national policy, city permits, developers, landlords and households. Finance ministries hold the budget rules. No single heat map resolves those handoffs.
A decision-ready approach begins by asking which service must continue. For a market, the objective may be safe trading hours and reduced exposure for vendors and customers. For a distribution grid, it may be equipment performance under coincident high temperature and peak demand. For a school, it may be safe classroom temperature and attendance. For a hospital, it may be uninterrupted cooling, water and power. The intervention follows the service, not the other way around.
Freetown shows that the record can end in a roof, not a dashboard
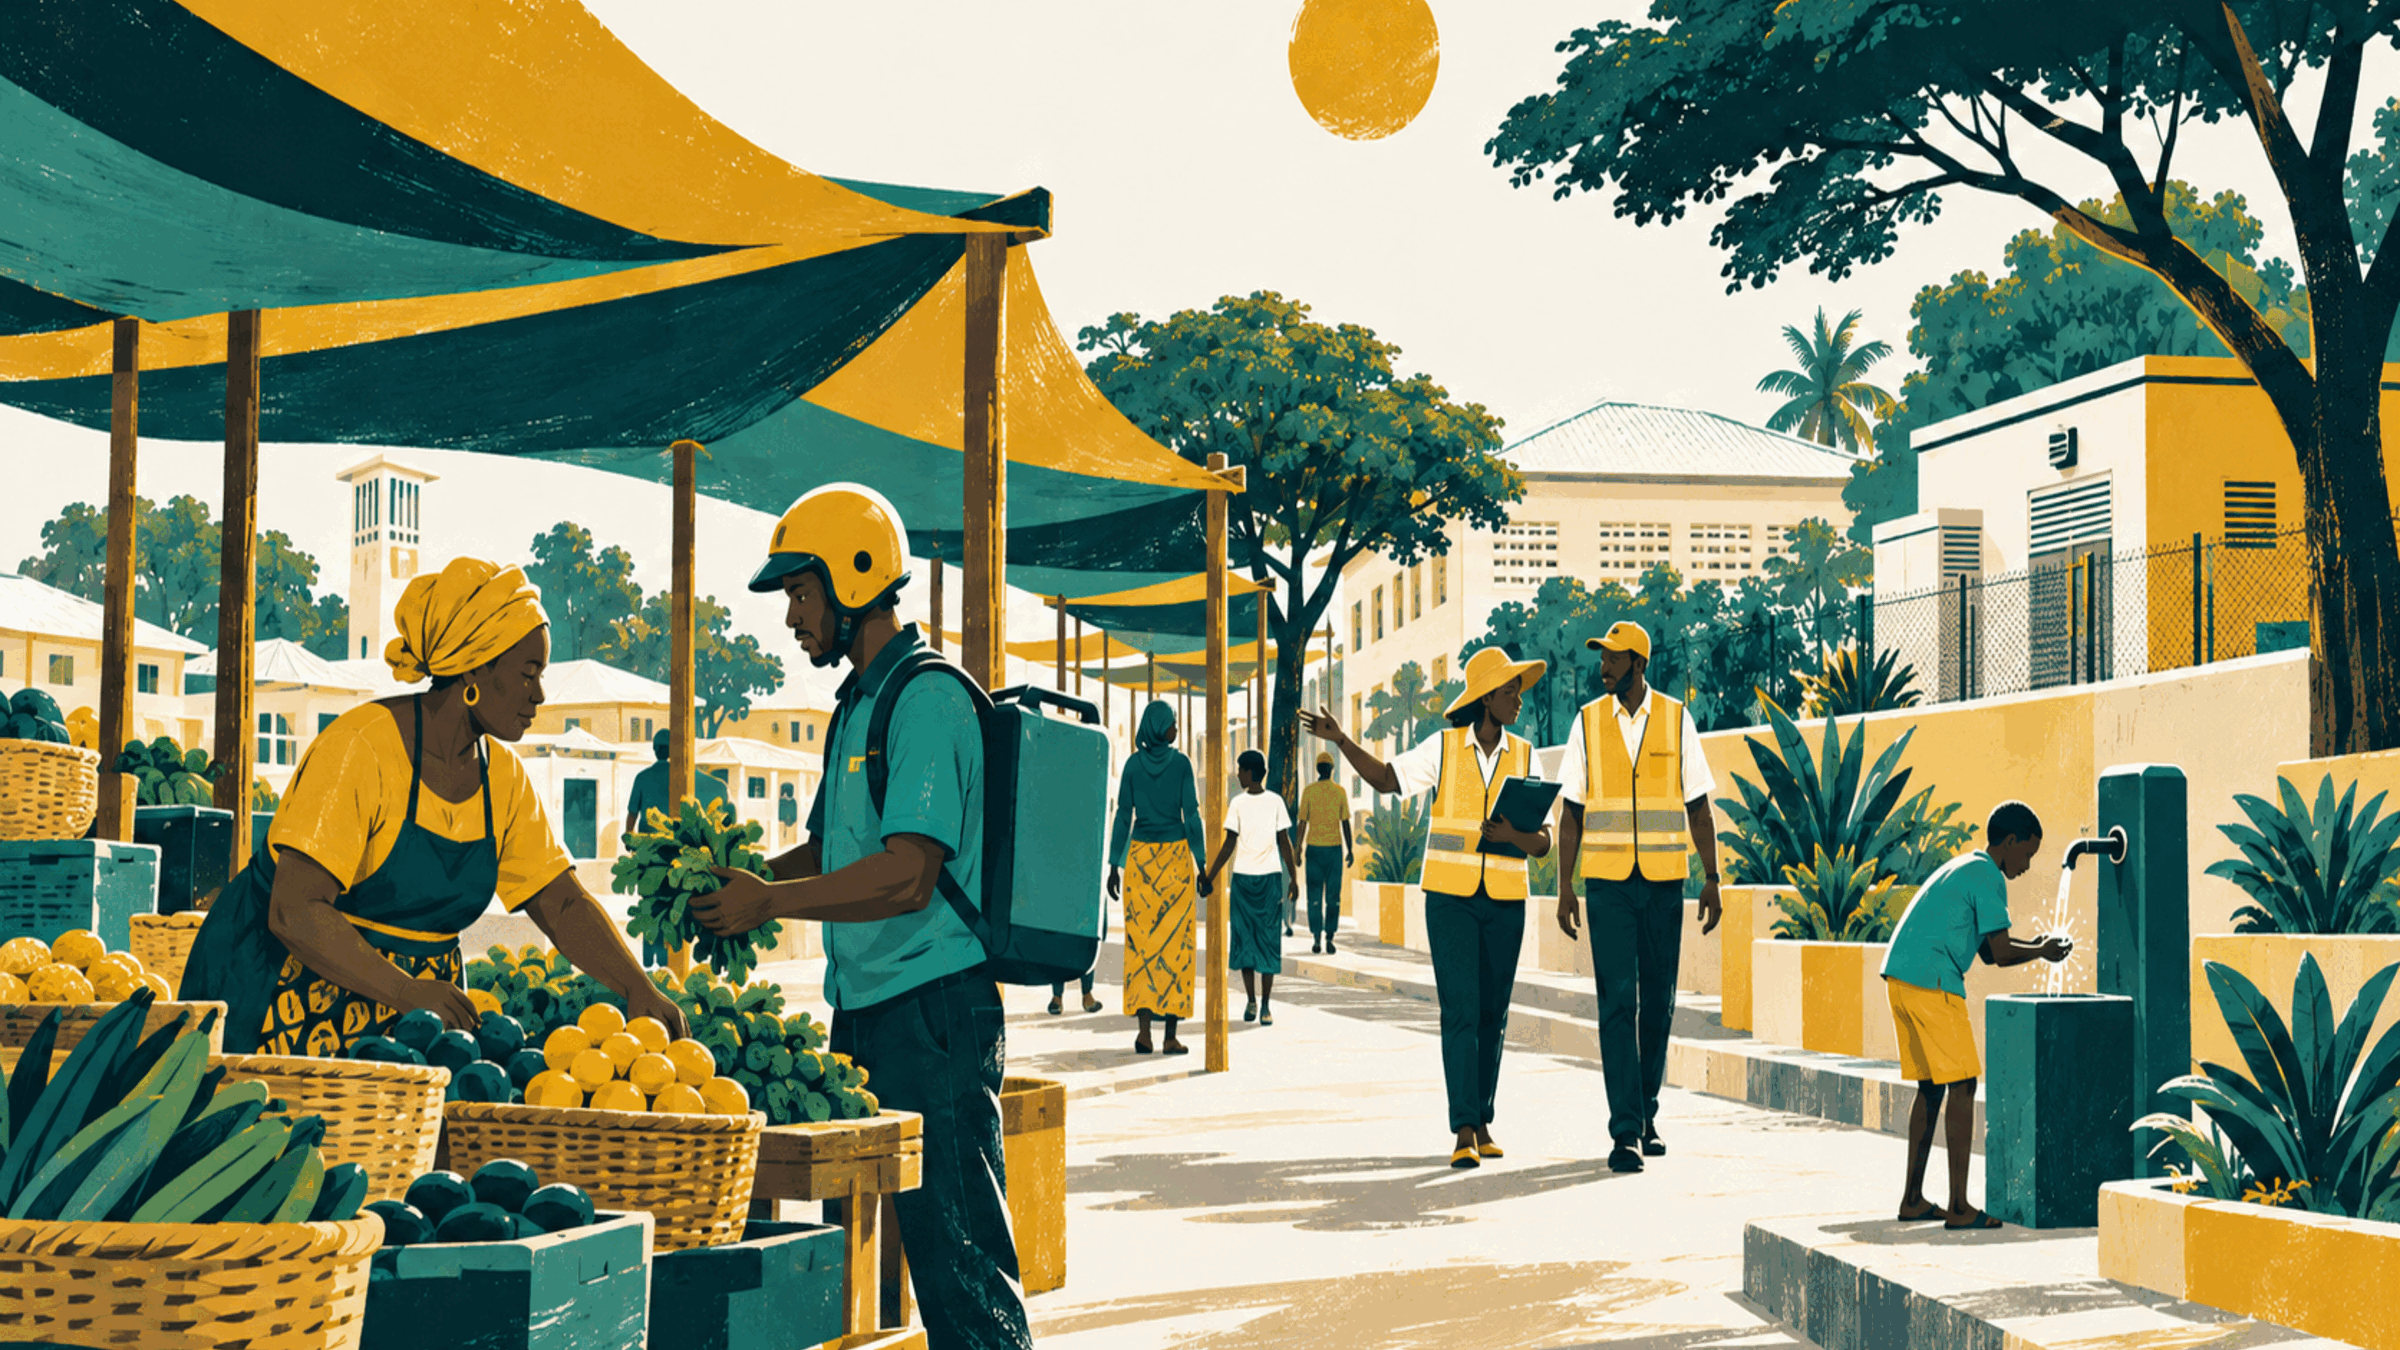
Freetown offers a grounded example of climate governance reaching livelihood infrastructure. The city launched a Heat Action Plan in February 2025 after establishing a climate office and Chief Heat Officer role. Earlier market interventions installed 669 square metres of shade and 40 solar lights across three street markets. An implementing-partner case note reported more than 2,300 women directly benefiting and about 11,500 people benefiting indirectly. [11][12]
The intervention is modest beside a citywide capital plan, and the beneficiary figures are implementer-reported rather than an independent impact evaluation. Its importance is institutional. Heat risk was translated into a place, a service - safer market activity - a responsible city structure and a physical intervention. Weather stations, community and mobile-sensor mapping and heat-health coordination were still being developed, meaning the learning loop remained incomplete. [11]
Cape Town and Accra illustrate different points in the chain. Cape Town's 2024 community mapping campaign covered roughly 200 square kilometres with 30 volunteers and recorded a peak ambient temperature of 41.6°C in Woodstock on the campaign day. The city linked heat readiness to service continuity, emergency response and learning. [13] In Accra, municipal teams trained enumerators and combined sensors with surveys of households, hawkers, outdoor workers, markets and transport areas. The intended outputs include vulnerability maps, emergency procedures, early-warning coordination and targeted shade, ventilation and water investments. [14][15]
These examples should not be overclaimed. Cape Town's campaign was a one-day spatial snapshot, not a mortality study. Accra had not officially published its full vulnerability assessment when preliminary hotspots were announced in December 2025. They show institutions building a decision system; they do not yet prove long-term risk reduction.
4 | FROM EXPOSURE TO A PROJECT PIPELINE
Project preparation is where risk data either gains authority or loses it
Climate-finance debates often present money as the last missing input. Money is indispensable, but it cannot finance an unspecified response. Capital moves through projects, programmes, budget lines, procurement packages, utility plans, regulations and operating contracts. Each needs a scope, owner, cost, timetable and evidence of benefit.
The GCA-CPI assessment shows how demanding this translation is. Africa's tracked adaptation finance rose from US$6.3 billion in 2017 to US$14.8 billion in 2023, but the latter amount was only about one fifth of assessed annual need. It also found a narrow sectoral distribution: agriculture, forestry and land use; policy and budget support; water and wastewater; transport; and disaster-risk management received much of the tracked finance, while buildings and infrastructure accounted for 2 per cent, energy systems 1 per cent and industry 0.5 per cent. [5] Tracking categories and undercounting limit precision, but the pattern suggests that climate resilience in core productive systems is not yet financed at the required scale.
The same assessment links readiness to clear mandates, identified priority sectors, costed adaptation needs and specific goals. [5] These are not administrative extras. They determine whether an institution can absorb funding and deliver.
The African Development Bank and Global Center on Adaptation's rapid climate-risk assessments for African cities illustrate an upstream response. The programme used city scans and risk assessments to inform adaptation strategy, project prioritisation and preparation, with a stated aim of integrating resilience into infrastructure investment. [7] The grant-funded assessments were modest compared with infrastructure capital. Their value lay in creating a shared evidence base before project design.
Kenya's Financing Locally Led Climate Action programme shows more of the chain in operation. Participatory risk assessments and county climate-action plans were completed in 45 counties in 2023. By December 2025, the World Bank reported functioning resilience investments in 1,238 rural wards, 42 counties meeting grant performance conditions and 91 per cent of participating counties having spent more than half of approved resilience grants. [16] The same implementation report recorded delays and said the expenditure-tracking and climate-tagging dashboard was still in progress. The case is useful because it contains progress and incompleteness at once: local risk data reached grants and operating investments, while the consolidated financial evidence system lagged.
The implication is not that every map needs a new project-preparation facility. It is that climate information must enter the documents that allocate authority: capital plans, asset-management systems, budget instructions, procurement specifications, utility standards and operating protocols. Otherwise, the map remains advisory while the binding decision is made elsewhere.
5 | STONECOMMS ORIGINAL SYNTHESIS
The Decision-Ready Climate Record
The following framework is a StoneComms original synthesis based on the cited hazard, urban heat, public-finance, project-preparation and adaptation-finance evidence. [1][3][4][5][7][8] It proposes a common minimum record that can accompany a climate-risk priority from diagnosis through implementation.
1. PLACE | Where is the decision unit?
Name the smallest geography or asset at which action can realistically be taken: a market, school cluster, feeder, drainage basin, road segment, health district, industrial area or settlement. Retain the wider system boundary where risk travels across it. National evidence may set strategy; implementation usually needs a more precise unit.
2. THRESHOLD | What physical condition triggers concern or action?
Record the hazard indicator, baseline period, time horizon, scenario and uncertainty. Define an operational threshold where possible: temperature and duration, rainfall intensity, flood depth, soil moisture, wind speed or coastal level. A threshold should connect to service performance or public protection, not simply to a colour category.
3. PEOPLE AND SERVICE | What is exposed, and whose loss counts?
Identify the people, livelihoods, assets and essential services affected. Disaggregate where evidence permits by income, gender, age, disability, tenure and occupation. Record informal and unpaid activity that asset databases may miss. State the service objective: safe learning, reliable power, accessible healthcare, passable roads, food-market continuity or protected income.
4. DECISION | What must change?
Name the binding choice: land-use permission, design standard, operating rule, capital project, maintenance programme, alert protocol, social-protection trigger or procurement requirement. Avoid generic actions such as "build resilience". State alternatives and why the chosen intervention is expected to change exposure or vulnerability.
5. OWNER | Who has authority and operating responsibility?
Identify one accountable lead and the institutions required to cooperate. Separate the authority to approve, the organisation that pays, the entity that procures and the operator that maintains. Record handoffs, legal constraints and the point at which a warning becomes action.
6. FINANCE | What pays for preparation, capital and operation?
Cost studies, land or rights work, design, construction, community participation, maintenance, monitoring and contingency. Match financing to the benefit and the institution able to capture it. Public and concessional finance may carry public-good and distributional benefits; utilities and asset owners may finance avoided downtime or maintenance; private capital requires credible cash flows or risk transfer. Do not count an unfunded plan as a pipeline.
7. RESULT | What evidence will show that the decision worked?
Preserve the baseline and track implementation, service performance and distributional outcomes. Measure whether the intervention changed heat exposure, closure hours, equipment failure, health incidents, attendance, income loss or another relevant result. Record underperformance and contextual change. The purpose is not to manufacture attribution but to make learning cumulative.
The seven fields create a chain of custody for climate evidence. A hazard layer may be updated as models improve; a budget may be delayed; an owner may change. The record keeps the reason for the intervention and the responsibility for it connected. It can also show where the chain breaks.
6 | WHY BUDGET TAGGING IS NECESSARY BUT NOT SUFFICIENT
A label can reveal spending without proving risk reduction
Climate budget tagging helps governments identify expenditure related to mitigation or adaptation. Used well, it can improve transparency, coordination and fiscal planning. The 2026 joint report identifies stronger public financial management, climate budget tagging and contingent-liability planning as priorities for African governments. [1]
But a tag usually classifies money after or during allocation. It may show that a road programme has a climate component without revealing whether the most exposed segments were prioritised, whether the design standard changed or whether the road remained passable during extreme rain. It may count a health programme as adaptation without connecting it to heat thresholds, vulnerable populations or service performance.
The Decision-Ready Climate Record complements tagging by preserving the evidence chain beneath the label. The budget system can still aggregate spending. The record answers a different question: what risk did this specific decision address, for whom, through which service and with what result?
There is also a fiscal-risk argument. Extreme events create contingent liabilities through emergency response, public-asset repair, state-owned enterprises, social protection and economic disruption. If climate information sits outside asset registers and fiscal-risk statements, governments can underestimate both future losses and the value of preventive investment. The objective is not to attach a confident monetary value to every risk. It is to make material exposure visible before it becomes an unplanned claim on the budget.
7 | PAN-AFRICAN SCALABILITY
Standardise the record, localise the thresholds
A common data structure can support comparison without pretending African cities share one climate, institution or investment model.
In Sahelian and West African cities, long heat seasons, rapid urban growth and constrained municipal resources make neighbourhood-scale exposure and outdoor work central. The 2026 projections of more than 180 hot days in thousands of cities are conditional on a very-high-emissions scenario, but the current upward trend justifies design and operational stress tests now. [1]
In coastal cities, heat may combine with humidity, flooding, erosion and salt exposure. Port, drainage, transport and power systems can fail through linked events. A decision record should therefore preserve dependencies: protecting a substation is of limited value if the access road or water supply fails.
In East African highland cities, national heat averages may appear less severe, yet dense construction, informal roofing, valley topography and local hot spots can create specific exposure. The framework should not allow a continental heat narrative to displace local evidence.
In Southern African metros, utilities and municipalities may have stronger asset and data systems but face high inequality, water stress and power constraints. Integration may therefore focus on linking existing asset registers, tariffs, capital plans and neighbourhood vulnerability data rather than creating a new standalone platform.
In secondary cities, the constraint may be basic data and staffing. A simple record attached to a market, school, road or water project may be more valuable than a complex citywide digital twin. The minimum viable system is the one that a real institution can maintain and use.
In fragile and conflict-affected settings, data access, authority and continuity may be weak. Humanitarian early warning and social-protection systems may provide the most practical entry point, but community information must not expose people to surveillance, exclusion or political harm.
Replication should therefore occur at the level of fields and questions, not solutions. The threshold that matters to a road differs from a clinic. The same map may support both, but their decisions, owners, finance and results are different.
8 | IMPLICATIONS FOR POLICY, CAPITAL AND IMPLEMENTATION
1. Make every priority map name its next decision
Climate-risk products should identify the policy, plan, asset, procurement or operating process they are designed to influence. If the next decision is unknown, the product is research, not yet decision infrastructure.
2. Put service owners beside climate specialists
Meteorological, environmental and geospatial teams should work with engineers, health officials, market managers, utilities, budget officers and community representatives at the point of interpretation. Technical quality is necessary; institutional fit determines use.
3. Fund the translation layer
Development partners often fund hazard studies and construction while underfunding the work between them: asset inventories, options analysis, costing, safeguards, feasibility, procurement design and operating arrangements. That preparation should be treated as a financeable public good.
4. Require subnational and distributional evidence
National averages should not be the final basis for allocating local adaptation capital. Project sponsors should state who is exposed, whose data are absent and how benefits and burdens are distributed. Informal work, insecure tenure and unpaid care can be economically material even when they are poorly recorded.
5. Connect capital budgets to maintenance and protocols
Heat resilience is not only a capital programme. Shade structures need repair, trees need water, cooling systems need power, alerts need trusted communication and revised working hours need enforcement. Financing plans should distinguish preparation, capital, operation and emergency response.
6. Publish the failures as data
An adaptation evidence system biased toward successful projects will produce bad investment decisions. Financiers and governments should preserve baselines, delays, cost overruns, maintenance gaps, weak uptake and interventions that failed to reduce service disruption.
7. Use data standards without creating data monopolies
Common fields can improve comparison and interoperability, but they should not lock governments into one vendor, platform or proprietary risk score. Public institutions need access to methods, metadata and exportable records. Communities need appropriate rights, safeguards and routes to challenge how vulnerability is represented.
9 | RISKS, COUNTERARGUMENTS AND LIMITATIONS
Climate data is not politically neutral. The choice of hazard threshold, asset value, discount rate, population layer and time horizon changes which places appear urgent. A record can expose those choices; it cannot make them apolitical.
There is a risk of technocratic delay. Governments can keep improving maps while postponing obvious low-regret action such as shade, ventilation, warning protocols, drainage maintenance or protection of critical services. The framework should not become a new approval hurdle. Where evidence is sufficient and consequences are serious, action and learning should proceed together.
There is also a risk of false precision. Climate models provide ranges and scenarios, not street-level certainty decades ahead. Local heat measurements may be sparse. Informal settlements and livelihoods may be missing from official datasets. Avoided losses are counterfactual and vulnerable to optimistic assumptions. Investment cases should use ranges, sensitivity tests and explicit confidence limits.
Digital systems can reproduce exclusion. Mobile, property and utility data may underrepresent people without formal addresses, accounts or tenure. Fine-grained vulnerability data can create privacy and security risks. Community participation must influence priorities and safeguards, not merely validate a technical product after it is built.
Finance will not follow every well-prepared record. Many adaptation benefits are public, dispersed and difficult to monetise. High borrowing costs and debt constraints remain structural barriers. International partners retain responsibility for better terms, simpler access and grant or concessional resources for vulnerable countries. [1][5][6]
This paper is a desk study completed from public sources. It does not contain original climate modelling, household data, city measurements, engineering analysis, budget records, interviews or project evaluation. Figures combine different geographies, methods and periods and are not directly comparable. The 2,964-city heat figure is a scenario-based sum for West African urban agglomerations under RCP 8.5 around 2050, not a prediction that every city will experience identical conditions. [1]
The Decision-Ready Climate Record is a conceptual framework. Its usefulness, administrative cost and interoperability require testing with real institutions and projects.
10 | COMMISSIONABLE RESEARCH AGENDA
Test where the evidence chain breaks
The next useful commission is not another continental hazard atlas. It is a comparative audit of how climate evidence changes real urban investment and operating decisions.
A 24-week programme could follow 18 decisions across six African cities: three markets or public spaces, three school or health clusters, three power or water assets, three transport corridors, three housing or land-use decisions and three social-protection or heat-response protocols. The sample should include capital projects, operational changes and at least four cases where a climate-risk assessment did not lead to implementation.
For each case, the research should reconstruct the chain from data to result: source models and measurements; resolution and uncertainty; asset and population data; decision minutes; budgets; project-preparation documents; procurement; safeguards; operating responsibility; maintenance; service disruptions; and community experience. Interviews should include climate and planning teams, finance ministries, city departments, utilities, workers, residents, financiers and project-preparation facilities.
The programme should test a common Decision-Ready Climate Record and answer five practical questions:
- At which handoff is climate information most often lost?
- Which minimum fields improve prioritisation without overloading local capacity?
- How do informal settlements, informal work and unpaid care alter the apparent investment priority?
- Which preparation costs are least likely to be financed, and by whom should they be carried?
- Which outcome measures can be compared without erasing local context?
Outputs should include a tested record schema, decision-chain maps, open implementation case files, model procurement and budget language, a project-preparation cost benchmark, data-governance safeguards, and a portfolio of investable or budget-ready interventions. The likely clients are finance and planning ministries, municipalities, utilities, development banks, climate funds, insurers, foundations and infrastructure investors.
The commercial value lies in reducing two forms of waste: capital committed without a clear resilience result, and high-quality climate evidence that never reaches a binding decision.
11 | CONCLUSION
The useful map is the one that changes what gets built
Africa does not need to choose between better climate science and faster implementation. It needs the institutional connections that allow each to improve the other.
The newest continental evidence reveals both progress and a warning. Hazards can increasingly be mapped across countries and within them. Extreme heat, precipitation and drought are becoming more visible. Yet the record of adaptation - what was decided, financed, delivered and learned - remains fragmented.
That gap is not clerical. It affects which neighbourhood receives shade, which road is rebuilt to a different standard, which substation survives peak heat, which workers are protected and which government absorbs the next unplanned loss.
Treating climate data as decision infrastructure changes the question. The measure of success is no longer whether a map exists. It is whether the evidence has a place, a threshold, people and services, a decision, an owner, finance and a result.
STONECOMMS ORIGINAL SYNTHESIS
The map before the money should not be a gate that delays action. It should be the chain of custody that keeps climate evidence attached to a real decision until somebody has acted, paid, operated and learned.
Methodology
METHODOLOGY AND EVIDENCE NOTE
This desk study was completed on 10 September 2026. It prioritises primary and authoritative sources from the OECD, Global Green Growth Institute, World Bank, World Meteorological Organization, United Nations Environment Programme, Global Center on Adaptation, Climate Policy Initiative and African Development Bank. The principal 2026 climate dataset covers 28 African countries and combines historical and projected hazard indicators, urban analysis and policy diagnostics; results are not a census of all African countries or adaptation interventions. Quantitative claims retain the geography, period, scenario and measurement limits stated by their sources. No proprietary data, fieldwork, interviews or original climate modelling were used.
Limitations
9 | RISKS, COUNTERARGUMENTS AND LIMITATIONS
Climate data is not politically neutral. The choice of hazard threshold, asset value, discount rate, population layer and time horizon changes which places appear urgent. A record can expose those choices; it cannot make them apolitical.
There is a risk of technocratic delay. Governments can keep improving maps while postponing obvious low-regret action such as shade, ventilation, warning protocols, drainage maintenance or protection of critical services. The framework should not become a new approval hurdle. Where evidence is sufficient and consequences are serious, action and learning should proceed together.
There is also a risk of false precision. Climate models provide ranges and scenarios, not street-level certainty decades ahead. Local heat measurements may be sparse. Informal settlements and livelihoods may be missing from official datasets. Avoided losses are counterfactual and vulnerable to optimistic assumptions. Investment cases should use ranges, sensitivity tests and explicit confidence limits.
Digital systems can reproduce exclusion. Mobile, property and utility data may underrepresent people without formal addresses, accounts or tenure. Fine-grained vulnerability data can create privacy and security risks. Community participation must influence priorities and safeguards, not merely validate a technical product after it is built.
Finance will not follow every well-prepared record. Many adaptation benefits are public, dispersed and difficult to monetise. High borrowing costs and debt constraints remain structural barriers. International partners retain responsibility for better terms, simpler access and grant or concessional resources for vulnerable countries. [1][5][6]
This paper is a desk study completed from public sources. It does not contain original climate modelling, household data, city measurements, engineering analysis, budget records, interviews or project evaluation. Figures combine different geographies, methods and periods and are not directly comparable. The 2,964-city heat figure is a scenario-based sum for West African urban agglomerations under RCP 8.5 around 2050, not a prediction that every city will experience identical conditions. [1]
The Decision-Ready Climate Record is a conceptual framework. Its usefulness, administrative cost and interoperability require testing with real institutions and projects.
Sources
Public evidence was checked through 10 September 2026. The Decision-Ready Climate Record is explicitly labelled StoneComms original synthesis. It is a proposed translation and accountability framework for further institutional testing, not a hazard model, engineering standard, investment recommendation or claim of original fieldwork.
REFERENCES AND DATA NOTES
- OECD, Global Green Growth Institute and World Bank. New Data for Africa's Changing Climate: Mapping Risks, Readiness and Policy Action. 1 September 2026. https://doi.org/10.1787/27d083ca-en
- World Meteorological Organization. State of the Climate in Africa 2025. 18 June 2026. https://wmo.int/resources/publication-series/state-of-climate-africa/state-of-climate-africa-2025
- World Bank, UN-Habitat and UNEP. Handbook on Urban Heat Management in the Global South. 2 September 2025. https://www.worldbank.org/en/topic/urbandevelopment/publication/handbook-on-urban-heat-management-in-the-global-south
- Jones, Nicholas K.W., Shreya Bansal, Carlyn Mann and Chandan Deuskar. Urban Heat: Planning and Implementing Investments for Heat Resilience. City Climate Finance Gap Fund Technical Note. World Bank, 2026. https://openknowledge.worldbank.org/bitstreams/104dae91-73e1-4d74-8315-f4ae1884e48d/download
- Global Center on Adaptation and Climate Policy Initiative. Adaptation Finance Flows to Africa - State and Future Trends. 10 September 2025. https://gca.org/reports/adaptation-finance-flows-to-africa-state-and-future-trends/
- United Nations Environment Programme. Adaptation Gap Report 2025: Running on Empty. 29 October 2025. https://www.unep.org/resources/adaptation-gap-report-2025
- Africa Adaptation Acceleration Program. Rapid Climate Risk Assessments for Five African Cities (Batch II). African Development Bank and Global Center on Adaptation, 2022. https://aaap.afdb.org/projects/rapid-climate-risk-assessments-five-african-cities-batch-ii
- World Bank. Infrastructure Foundations: From Current Assets to Future Growth. 2026. https://www.worldbank.org/en/topic/infrastructure/publication/infrastructure-foundations-from-current-assets-to-future-growth
- United Nations Environment Programme. Global Cooling Watch 2025. 2025. https://www.unep.org/resources/global-cooling-watch-2025
- United Nations Environment Programme and Cool Coalition. Beating the Heat: A Sustainable Cooling Handbook for Cities. 3 November 2021. https://www.unep.org/resources/report/beating-heat-sustainable-cooling-handbook-cities
- C40 Cities. Request for Proposals: Supporting Freetown's Heat Action Plan. June 2025. https://www.c40.org/wp-content/uploads/2025/06/RfP_RF_Freetown.pdf
- UN Climate Change High-Level Champions. Cooling Freetown's markets: a sustainable solution for women traders. 22 November 2023. https://www.climatechampions.net/media/news/cooling-freetown-s-markets-a-sustainable-solution-for-women-traders/
- City of Cape Town. Local government needs to lead in tackling challenges of extreme heat. 2024. https://www.capetown.gov.za/Media-and-news/Local%20government%20needs%20to%20lead%20in%20tackling%20challenges%20of%20extreme%20heat
- Accra Metropolitan Assembly. AMA conducts citywide heat vulnerability assessment. October-December 2025. https://www.ama.gov.gh/news-details.php?n=OTY2OXBzcW4yMHEzNnBwcDBvcTZzM284NXMxNjExMzk3NHBwOXE3OQ%3D%3D
- Information Services Department, Ghana. AMA launches citywide heat campaign and resident survey to tackle extreme temperature. 17 July 2026. https://www.isd.gov.gh/ama-launches-citywide-heat-campaign-and-resident-survey-to-tackle-extreme-temperature/
- World Bank. Financing Locally Led Climate Action Program: Implementation Status and Results Report. Archived 10 February 2026. https://documents1.worldbank.org/curated/en/099021026051034297/txt/P173065-b2b49b19-0867-4aed-b598-477842104ff4.txt
Data notes
- The 2,964-city figure sums 2,712 small, 229 intermediate and 23 large West African urban agglomerations projected in [1] to experience more than 180 days above 35°C around 2050 under RCP 8.5. It is a scenario result, not a deterministic forecast.
- The near-doubling of hot-day frequency and more than 150 per cent increase in extreme-precipitation frequency in [1] are indexed trends across the 28 countries assessed, with 1990 set to 100.
- The US$14.8 billion tracked adaptation flow and at least US$70 billion annual need in [5] use CPI and NDC-based methods; undercounting and classification differences are material limitations.
- UNEP's US$310-365 billion annual adaptation need in [6] applies to developing countries globally in 2035, not to Africa alone.
- The 700 per cent increase in urban-poor heat exposure cited in [3] is a Global South projection, with greatest impacts expected in Africa and Asia; it is not an Africa-only estimate.
- Freetown beneficiary figures in [12] are reported by the programme and are not an independent impact evaluation. Cape Town's temperature in [13] is a campaign-day observation, not a citywide annual measure. Accra's cited work describes assessment and intended decisions, not verified outcomes.
- Kenya FLLoCA results in [16] are programme monitoring figures. A functioning investment records implementation status, not a causal estimate of avoided climate loss.